Collect SharePoint telemetry with Azure Application Insights. Part I. Server-Side
Microsoft Azure provides a lot of services and some of them may be used even you prefer on-premise based application.
With this post, I start the series of three posts about Azure Application Insights and implementing it in your SharePoint on-premise environment. It will be helpful, no matter which version of SharePoint you use, Server or Foundation, old 2010, or modern 2019.
Application Insights
Application Insights is an Azure-based service (you can't download it and install in your environment) allowing you to collect usage data of your live applications. Once data is collected you have extra features such as performance anomalies, an abnormal rise of exceptions, and others.
Azure
Azure-based service means you need to have an active Azure subscription. In case you don't start from here: https://azure.microsoft.com/en-us/free/. It should not take long.
If you have an Azure subscription and SharePoint (single server or farm) you are ready to go.
Create Application Insights
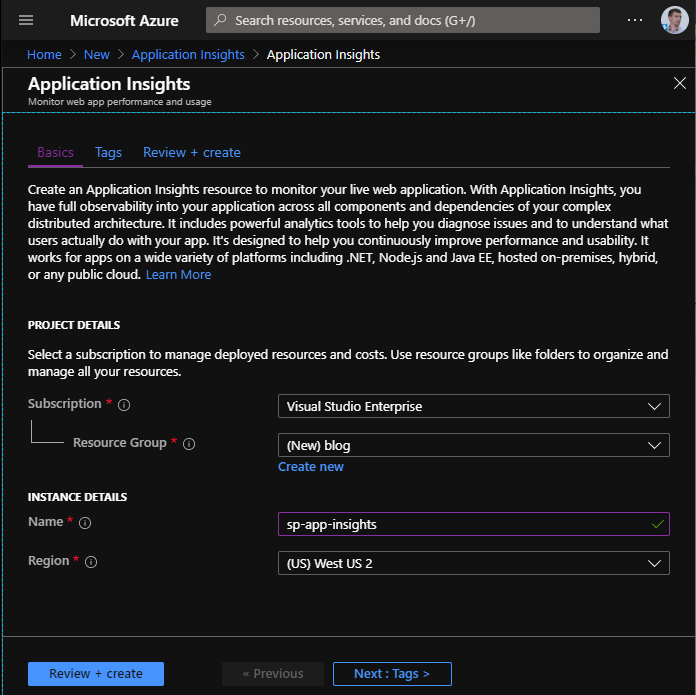
Create new Application Insights in your subscription choosing the data center closest to you:
SharePoint Farm
I have the following test SharePoint 2019 Farm where I'm going to implement monitoring:
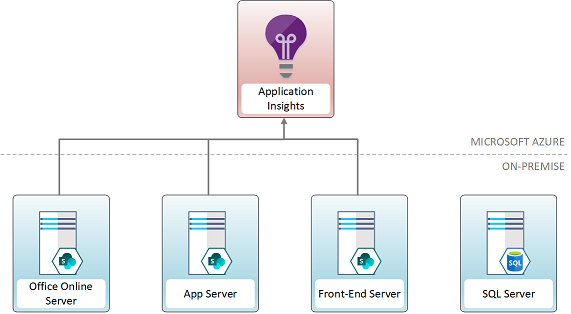
There are four servers in my farm:
- Office Online Server
- Application Server
- Web Fron-End Server
- SQL Server
The first three servers will be covered with monitoring. I'll set up it for all SharePoint-related IIS applications and services. SQL Server is not monitorable with Application Insights.
Info
Application Insights service allows tracking dependencies such as the execution of SQL-query.
Web Platform Installer
To implement monitoring with Application Insights we need to install it on every front-end and application server in the SharePoint Farm. There is a simple approach to achieve it: use Microsoft Web Platform Installer. Download the extension and install it on your server.
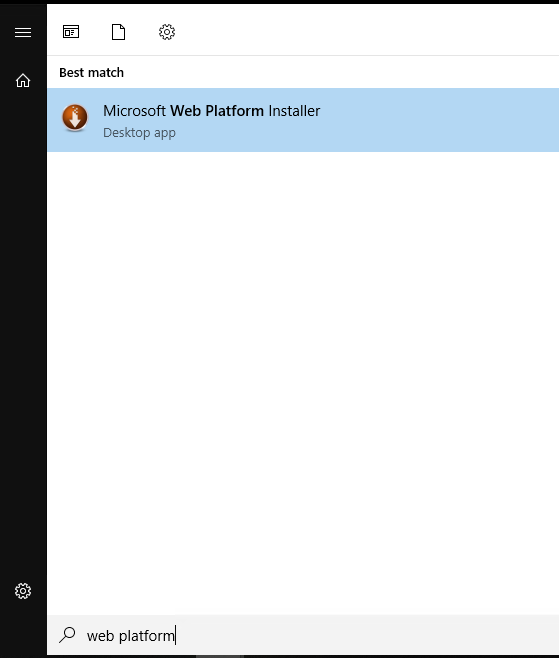
After installation, find it by typing "web platform" in the start menu.
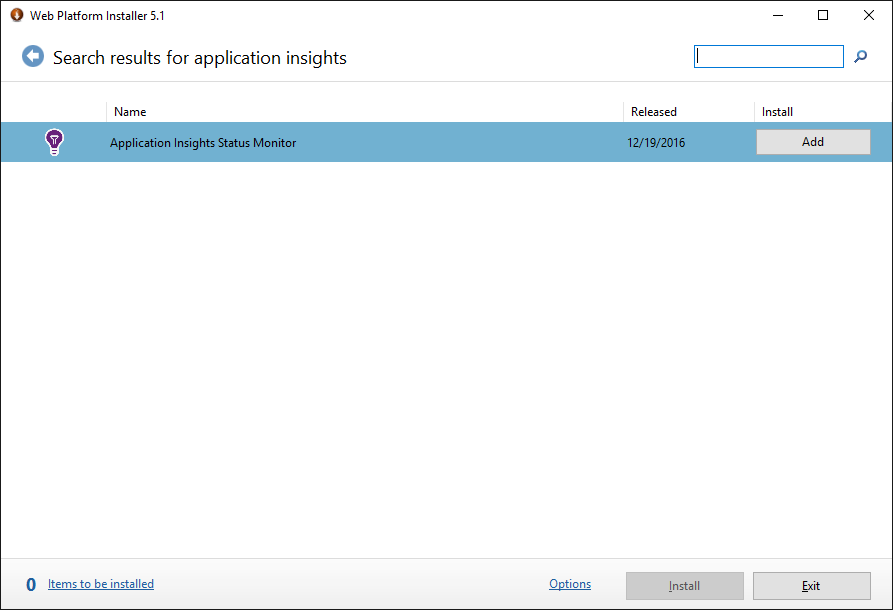
In the platform installer type in "application insights" in the search box, click Add next to Application Insights Status Monitor and then click Install to start the installation.
Once Application Status Monitor installed it will be launched automatically.
Application Insights Status Monitor
Sign in your Azure account. It's necessary in order to get a list of existing Application Insights or create a new one.
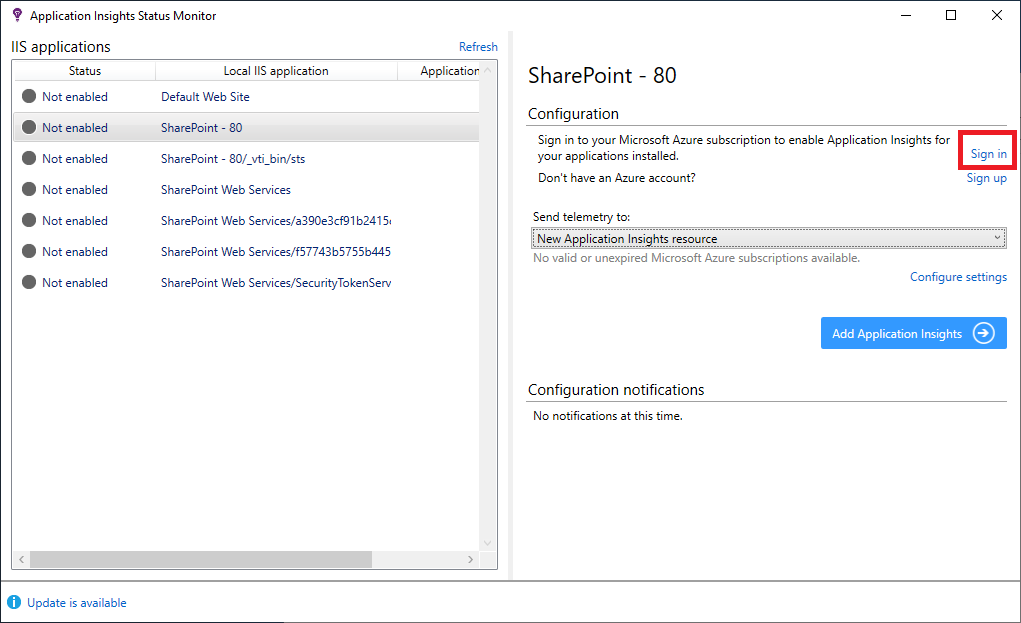
In my case, I use a single Application Insights service for all servers and IIS applications on my farm.
Select an application you want to monitor in the list and click Add Application Insights
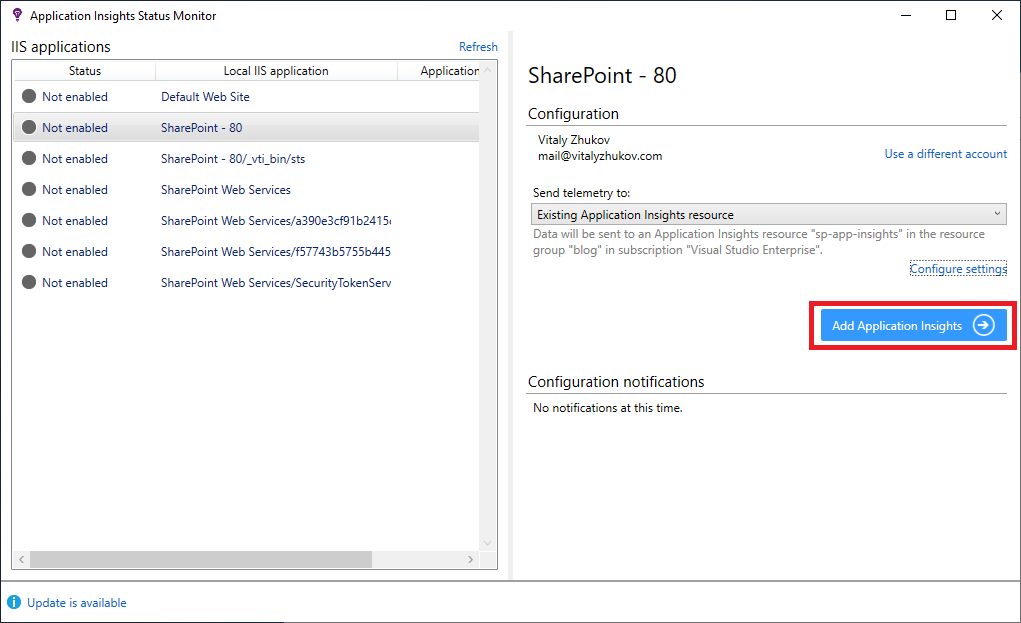
After setup telemetry collection restart IIS to apply changes.
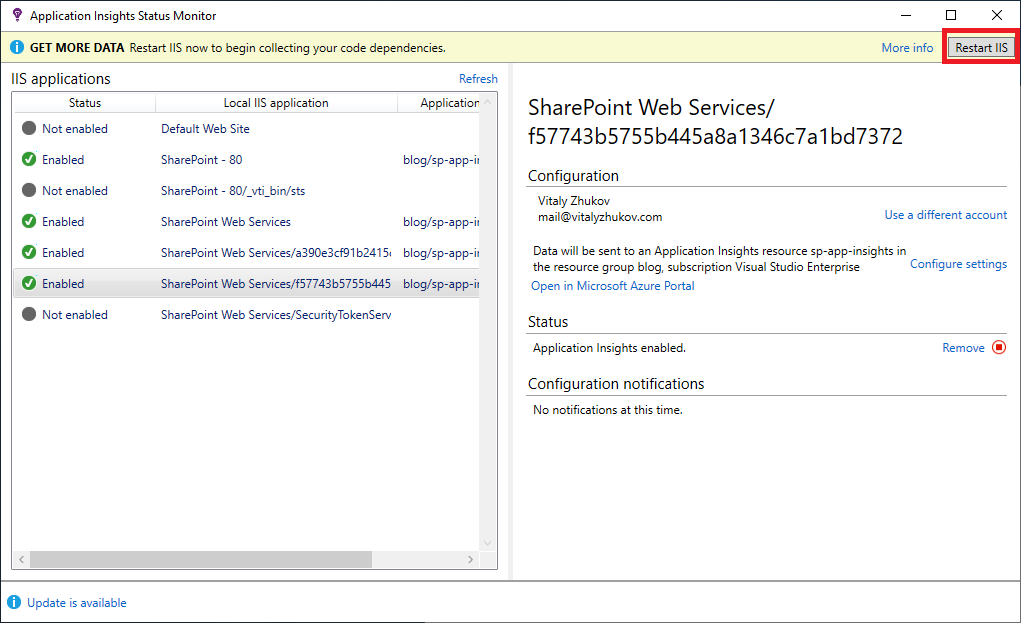
Repeat these steps on all servers and the implementation will be done.
Implementation checklist
Summarizing what needs to be done here is a checklist:
- Setup Azure Subscription
- Create Application Insights resource
- For each APP and WFE server in a farm:
- Install Web Platform Installer
- Install Application Insights Status Monitor
- Enable Monitoring for IIS application
- Restart IIS
Features
Now we can use Application Insights functionality. I'll describe some features.
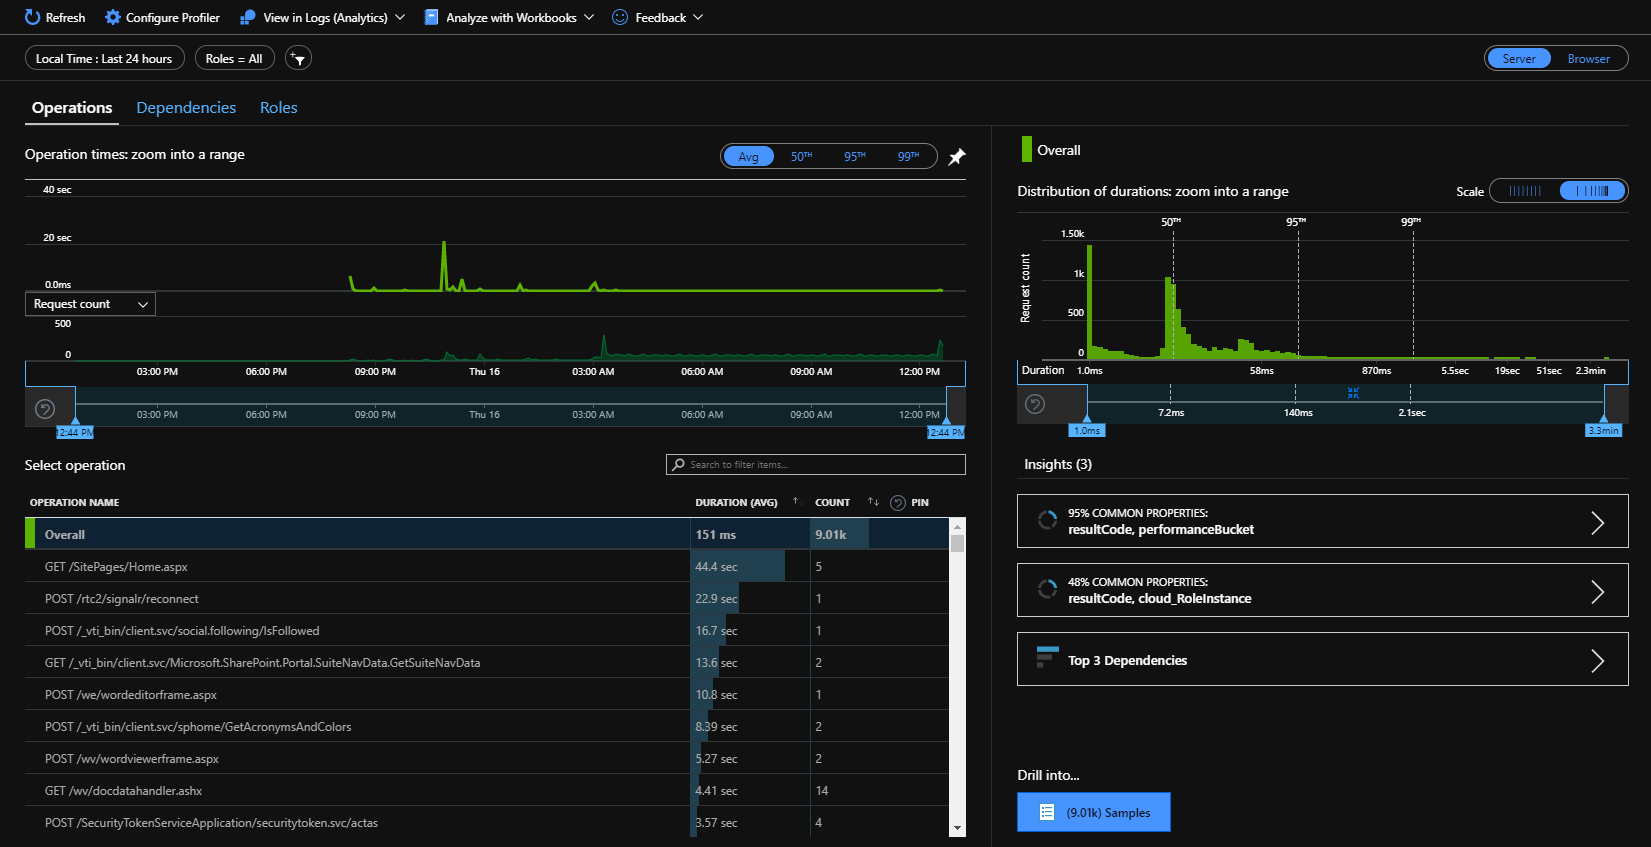
Performance
The performance section allows you to see what operations and requests are slowly within your environment. Also, you are able to drill into a specific request to investigate the end-to-end transaction with all dependencies.
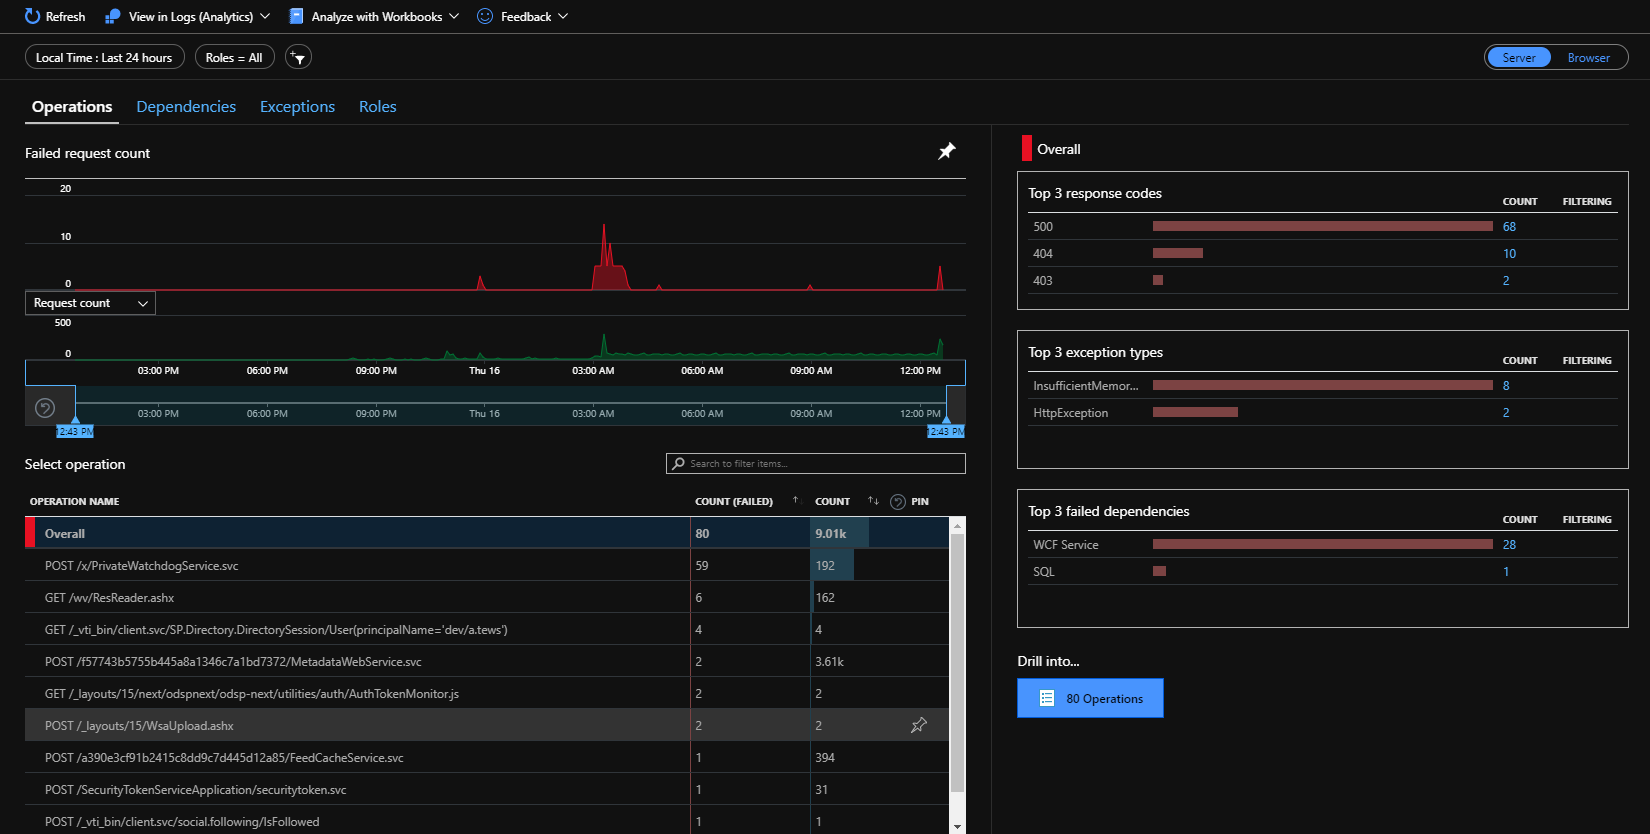
Failures
This section makes it possible to figure out what is wrong with your SharePoint farm and use a proactive approach to detect and solve problems.
Advice
Use the Failures section to know about problems with SharePoint to prevent support requests and keep your users happy.
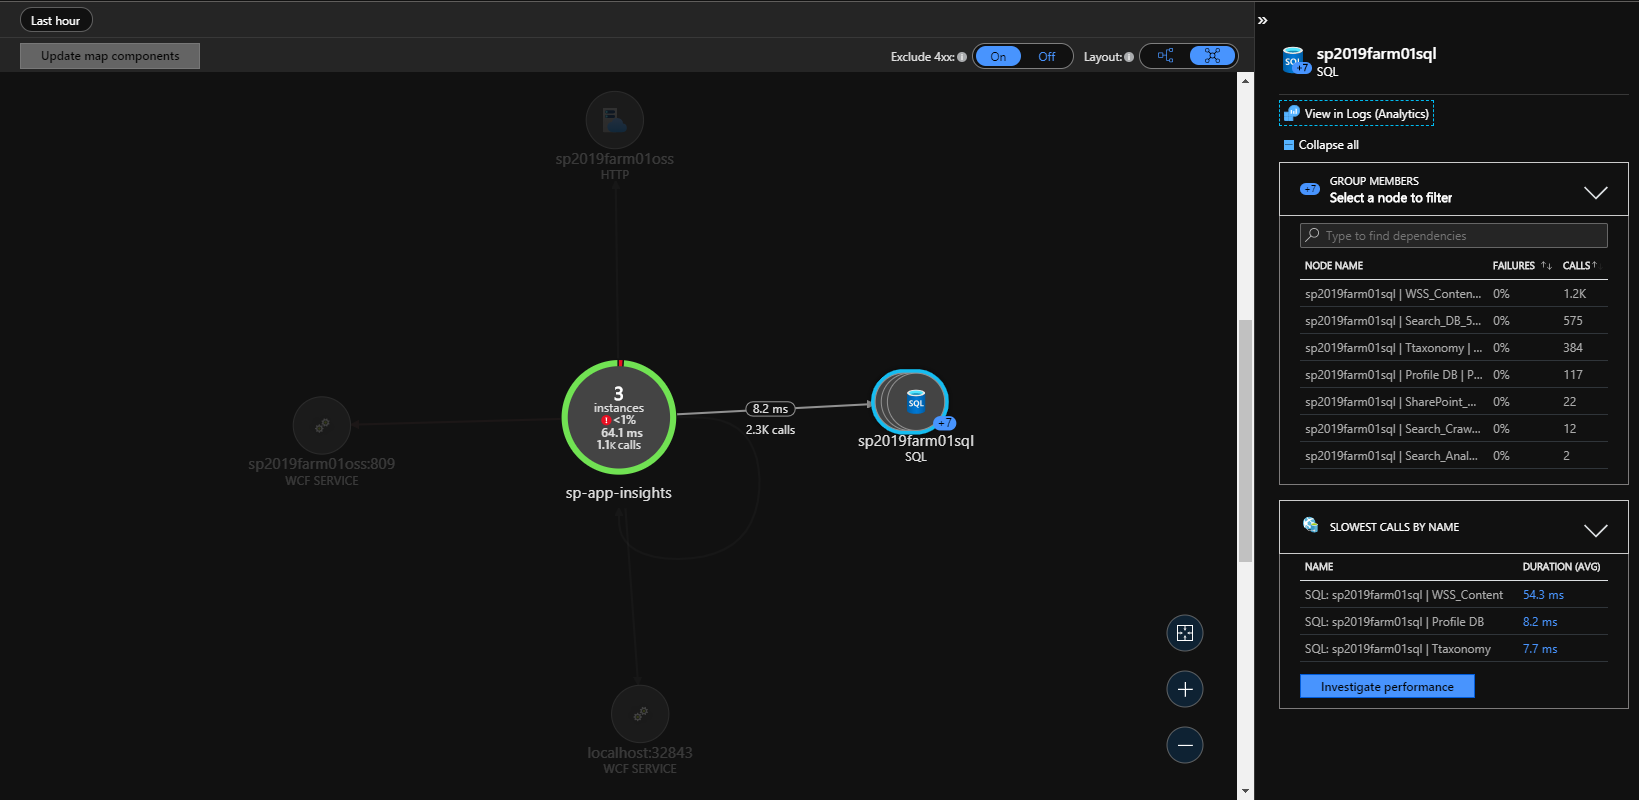
Application Map
Application Map is convenient for seeing the full picture and find flaws in the interaction of servers and / or services in your environment.
Log Analytics
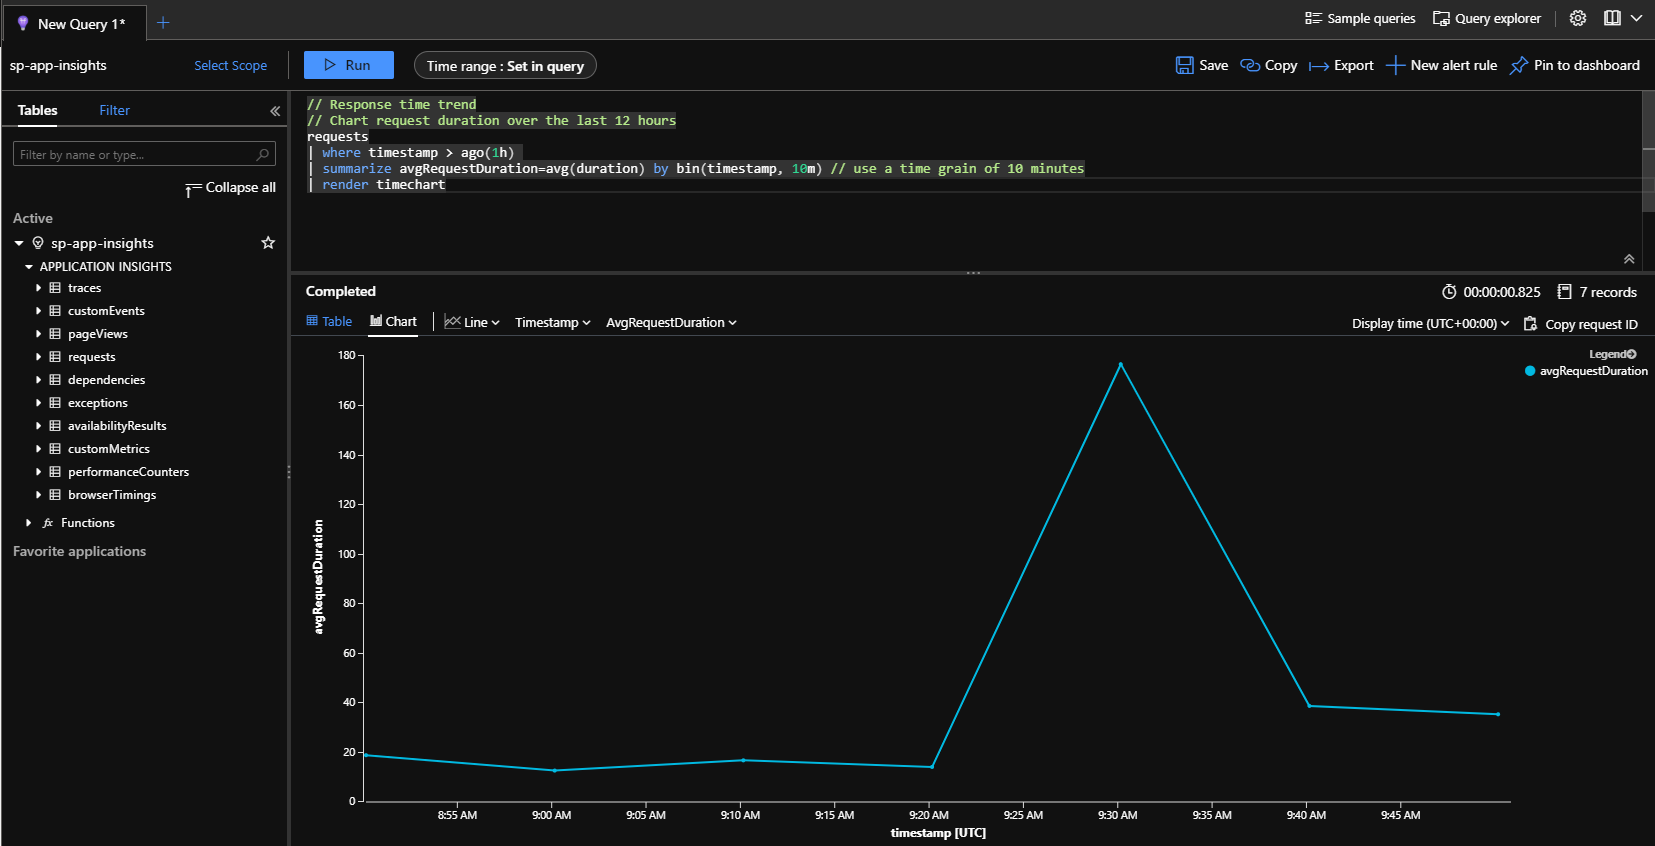
Log Analytics created to provide you access to all the data stored in Application Insights. There is a specific query language to retrieve the data you need.
Power BI
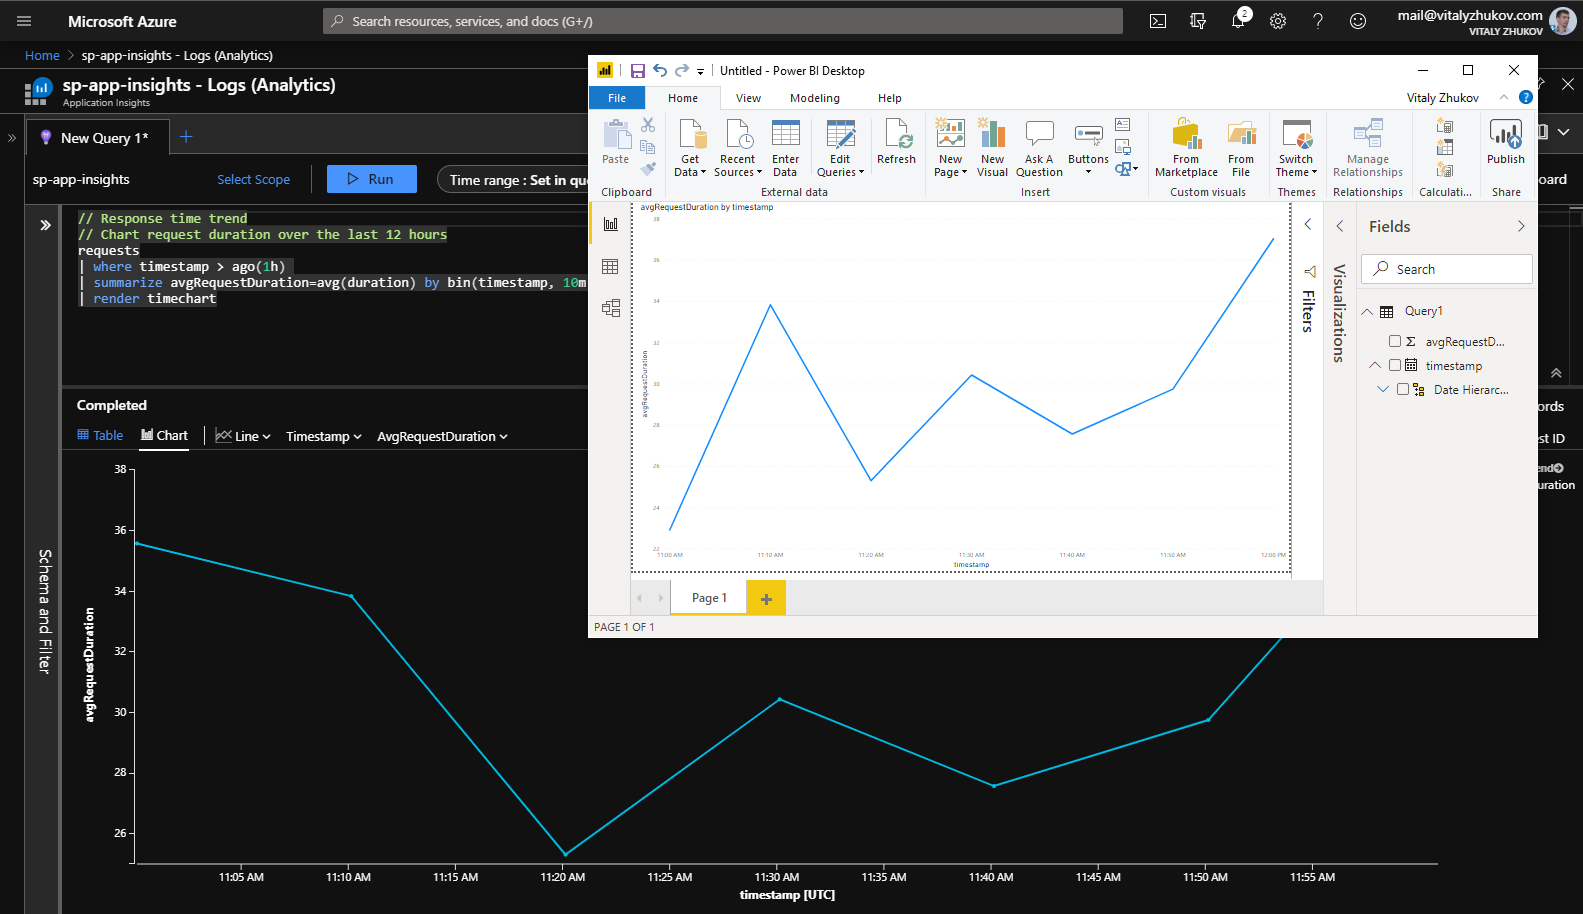
You have telemetry collection service, query language to retrieve the data. What is left? Dashboards, many dashboards.
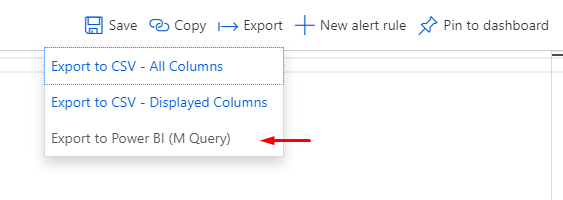
You can export your query from Log Analytics and use in Power BI
And build a dashboard as you want:
Smart Detection
Even if you have the data and dashboard to view it there is something else. We need a feature to do not spent the time viewing that stuff. And Azure has it - Smart Detection can send you an alert to let you know there is something you need to know.
All you need is set up rules and actions.
List of available Smart Detection rules:
- Slow page load time
- Slow server response time
- Long dependency duration
- Degradation in server response time
- Degradation in dependency duration
- Degradation in trace severity ratio (preview)
- Abnormal rise in exception volume (preview)
- Potential memory leak detected (preview)
- Potential security issue detected (preview)
- Abnormal rise in daily data volume (preview)
Summary
Application Insights is not only about the cloud. It can improve your on-premise applications and let you know how your applications work and where they need your attention.
If you don't use Azure yet Application Insights is a good point to start building up your hybrid ecosystem.


